Registration Statement
Prospectus
Form 10-K
Form 10-Q
Trough
Consumer Price Index (CPI)
Trade Deficit
Monetary Policy
Margin Requirements
Exchange Risk
Interest Rates
Yield -to- call
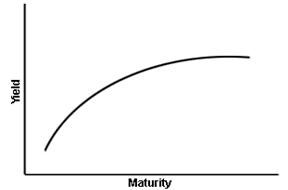
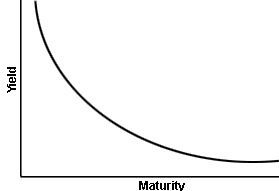
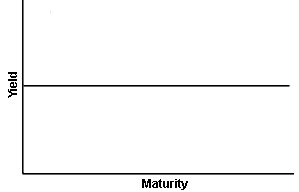
Yield Curves
Yield Spreads
Income Statements
FIFO
EBIT
Inflationary Risk
EPS ratio
Internal Rate Of Return
Net Present Value
Price-to-Book Ratio
Systematic Risk
Unsystematic Risk
Call Risk
Inflationary Risk
Preferred Risk

Economic Factors and Business Information
BUSINESS CYCLES
The business cycle or economic cycle is the downward and upward
movement of gross domestic product (GDP) around its long-term growth
trend. Simply put, the business cycle is the four stages of expansion and
contraction in an economy. This fluctuation in the economic activity
impacts
the return on securities.
The first stage of the business cycle begins after a low point in the economy called EXPANSION. During the expansion, the GDP, stock market and real estate values, inflation, and employment rates rise. Inventories decline as demand exceeds production. The predictable economic environment caused by stable economic policies allow stocks and bonds markets to perform well during the expansion.